The folks over at Desmos have been adding several features lately (but the ability to copy entire graphs into another activity is still on the way *hint*). One of the newest additions allows users to label points. As you can read in their announcement, they are proud of the fact that the labels do not get in your way or obscure the graph. The labels do a great job of getting out of each other’s way (nice feature, though it does mean it difficult to line up labels).
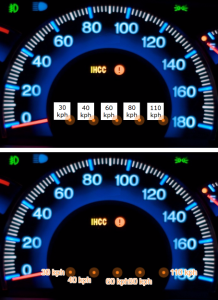
The big advantage is bringing a new way to add clarifying text to your graph or activity without inserting images. The image on the right shows a page from one of my activities and how it could be redesigned with labels. This activity explored unit conversions between measurement systems (TEKS 7.4E). At the screen shown, the user is prompted to label a speedometer (measuring miles per hour) with the equivalent speed measured in kilometers per hour. The original version on the top has five images with just a bit of text. Each image is joined to a movable point. Users move the point, and the image goes with it. It requires a few lines in Desmos and an image editor.
The alternate version on the bottom, simply uses five points, each with a label. No image editor required, no line in Desmos assigning the size of the image or tying the image’s location to a point. Just the point with a label. The back end is more elegant (though you see how the labels are not aligned–a sacrifice for simplicity).
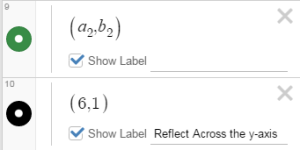
Labels are very intuitive in the activity builder interface. When you enter a coordinate, a new option appears beneath the ordered pair — a checkbox asking if you want to “Show Label.” Leave the box blank, and everything works as before. Check the box and the point’s ordered pair is displayed on the graph. Write something on the line next to the checkbox, and that text appears next to the point. Very versatile.

I think that we will see more creative applications of the label feature as users become more comfortable with the option. I’ve shared an innovative use of labels in a graph
- Student code: 824WH
- Teacher code (so you can tinker under the hood)
This activity shows how labels can help students explore transformations in the coordinate plane. A simple coordinate label of a point and its transformation help students observe how the coordinates are affected by a transformation. The labels on the right side of the graph, however, expand this activity by allowing the user to change to a different transformation.
