In a recent post I showed how I created movable triangles of fixed dimensions on a Desmos graph. It’s nice to have an outlined triangle, but nicer to shade in that triangle and make it easier to see. That is accomplished through clever application of Desmos’ ability to shade inequalities.
This is actually a simpler application than others. I have seen Desmos graphs that shade in triangles where all three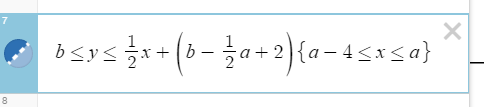 points are adjustable. That takes no less than six inequalities per triangle, and I’m still wrapping my head around that. In the meantime, coloring in a triangle with fixed dimensions (and therefore a fixed slope) isn’t too bad.
If a and b are x and y coordinates of the movable point, then we shade the compound inequality between the lower border of the triangle (y=b) and the upper border (the hypotenuse at y=[slope]x+b-[slope]a+[height]). We then constrain this shading only for x values between [a – width] and a.
Check out a sample at https://www.desmos.com/calculator/mngplm55jl